Feeds:
Posts
Comments

Twitter

The hype around Twitter has been growing enormously on the last weeks. Here in Brazil, writers from all around the web are writing and blogging about it everywhere. Almost everyone has a little blue bird on their blog side bar saying “follow me”.

Many bloggers and news corp have been using Twitter to broadcast news, which is very similar to what RSS already does. Check it out:

The Twitter way

  1. Blogger writes a new post;
  2. Blogger tweets about it and adds a tyniurl link to the post;
  3. Followers receive and read the tweet;
  4. If it’s interesting, they acess it.

The RSS way

  1. Blogger writes a new post;
  2. The post is automatically included on the blog RSS, no twitting needed;
  3. Signer accesses his RSS reader and gets the whole post, no clicking needed.

As I see it, to share news, RSS is simpler. No twitting nor clicking around.

So, why use Twitter then?

First of all, I don’t. I have an account, but rarely visit it. But, after reading and discussing a lot about it, I found out 2 interesting ways, one of which led to the recent hype.

  • Real time search. Using Twitter, everyone has access to everyone’s opinions about everything. It’s a soup of ideas about any topic you might imagine, and whenever new topics arise, people twitt about them. So, using tools like twitter search, it’s possible to learn what people are saying right now about some interesting topic. It’s unprecedent. And that’s why Sergei Brin and Larry Page are saying Twitter is ahead of Google on it.
  • Sharing comments. RSS exists to share news. Besides Google Reader recent advances on comment and sharing, RSS was not meant for it. Twitter wasn’ t also, but it does the job very efficiently. Whenever someone shares a link on twitter, they add a comment to it. They show their opinions to the world. So, you subscribe to a blog when you notice that blogger posts interesting stuff and you should follow someons when you see that someone posts interesting links and opinions.

Thinking about it, using twitter to share comments and news could kill RSS because people would only read news shared by their friends whom they trust. But, where would their friends find the news? From other twitts? It’s easy to see that this recursion would lead either to a news corp or blog twitt or to a RSS feed. So, the initial “sharers” will have to find the news somewhere and, as said, the best way is through rss.

So, calm down, RSS won’t die.

RSS

Mozilla Labs Bespin

A couple weeks ago, Magnun and I were trying to implement a new feature for CairoPlot 2.0, which will be called Series. At the time, we decided to create a draft of what we were doing before actually coding and versioning it.

Both of us were stunned to find that an online colaborative programming ide didn’t exist. So we opted for Google Docs which filled the gap but not without some problems (as no syntax highlight).

Today, Magnun just told me about the Mozilla Labs Bespin which aims to be exactly what I said before: an online colaborative programming ide right inside your browser. Check out the project link to see what has already been done.

I do hope these guys keep going with this, the interface looks great and their idea of reinventing the wheel (as they did for the scrollbars and text input areas) is not bad as they do it for great optimization.

Code Complete 2

Yeah, I finally gave up and decided to follow StackOverFlow users and Jeff Atwood advices and started to read Code Complete 2.

From the very first chapter, I’m starting to get why so much people love this book:

Software construction is the central activity in software development; construction is the only activity that’s guaranteed to happen on every project.

And yes, it’s true.

In the final analysis, your understanding of how to do construction determines how good a programmer you are, and that’s the subject of the rest of the book.

And this last one must be too as *SO* many people recommend this book.

What happens when a software enterpreneur and an offshore oil extractor come together?

Roger Green (the software enterpreneur) and David Cook (the offshore oil extractor) came together and decided to board the 600 best software engineers around the world to live on a boat 3 miles away from the US pacific coast. Right outside imigration range.

These guys will work 4 months and take 2 of vacations, which leads up to a pretty nice scenario of working just 2/3 of the year!

For more information, take a look at A plan to offshore . . . just 3 miles out or just go to the official page of the project.

Stack Overflow

Stack Overflow

One day, Jeff Atwood and Joel Spolsky decided to help the programming community. Along the way, other guys joined them (Jarrod Dixon, Geoff Dalgas, Jeremy Kratz and Brent Ozar) and they came with the absolutely fantabulous Stack Overflow.

From their About page

Stack Overflow is a programming Q & A site that’s free. Free to ask questions, free to answer questions, free to read, free to index, built with plain old HTML, no fake rot13 text on the home page, no scammy google-cloaking tactics, no salespeople, no JavaScript windows dropping down in front of the answer asking for $12.95 to go away. You can register if you want to collect karma and win valuable flair that will appear next to your name, but otherwise, it’s just free. And fast. Very, very fast.

It’s definitely that: fast. For the last weeks, I’ve been browsing a lot through the hot questions tab and I barely found unanswered questions. It’s amazing how fast you can get an answer and, for what I’ve seen, it’s usually the best.

The voting up and down associated with comments mechanism is also great, as you can learn through the answerer but also by everyone else’s knowledge. And they also have a badge system which rewards you depending on your attitudes (actually, by now I only have 8 bronze badges..).

This thing has been growing so fast that even the most famous programmers are getting into it. Alan Kay, for instance, is already one of them.

So, they have lots and lots of information there, go check it out!

Ah, and don’t forget to check these:

Hi there everyone.
Sorry for the long delay on posts and updates, lots of stuff happening.

So, CairoPlot now has a Mailing List as suggested by Yang. It’s actually a GoogleGroup named CairoPlot. Subscription is now open for anyone who’d like to discuss, question or suggest new features.

So… Join now!

CairoPlot 1.1

CairoPlot is on GitHub!

CairoPlot now has a Mailing List! For more information, refer to: this post.

v1.1 is out!!

CairoPlot is an API written in Python and uses PyCairo to plot 6 kinds of graphics.
Lots of changes happened since last post, CairoPlot now has a Logo, it’s not just me anymore, we have an all new repository and lots of new functions and options. Read the rest of the post to see all the changes.

LOGO

As you all must’ve seen on the beginning of this text, CairoPlot now has a logo! Actually I did two but I ended up choosing this one. What do you guys think?

CONTRIBUTOR

It’s not just me anymore! I’m happy to say that this release had GREAT help from João S. O. Bueno. It was his idea to change the code into object oriented style which turned out to be a great option for the project.

NEW REPOSITORY

I’d like to apologize to everyone who’s been using v1.0 since June. Many changes happened and no one even knew they were there. By the time the repositories where changed, João had just started helping the project and lots of things were incomplete. After that, one change lead to the other and the only stable release came out now. Again, I’m sorry but I believe you all will be pleased by the changes.
To visit the new repository, just hit CairoPlot Launchpad.

HOW TO DOWNLOAD

CairoPlot is on GitHub!

HOW TO HELP

I believe CairoPlot can grow a lot more, so if you think you can help, please contact me at alf.rodrigo@gmail.com.

NEWS

Now for the exciting ChangeLog.
All the old functions are still supported with some little but important changes.

overall changes

Every chart now has an associated class and a function.
The functions where kept to maintain backward compatibility and allow for easy use of the api.
The classes, however, provide much more customization as access to the cairo context or its surface.
All functions still have the background parameter, but now it supports colors (in tuple form, red = (255, 0, 0)) and Cairo Linear Gradients. The None option is still present and will generate the gray to white gradient of the previous version.

more output options

CairoPlot now outputs images on the following formats: pdf, ps, png and svg thanks to João.
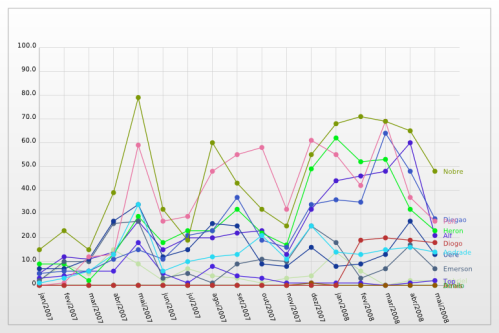
dot_line_plot

Dot Line Plot kept most of its functions but got a little more customizable.

dot_line_plot (name,
               data,
               width,
               height,
               background = None,
               border = 0,
               axis = False,
               grid = False,
               dots = False,
               h_labels = None,
               v_labels = None,
               h_bounds = None,
               v_bounds = None)

dots – new parameter added to determine whether or not the dots are needed;
h_legend and v_legend – got renamed to h_labels and v_labels;
Note: As this function’s been present since the last version, please refer to the latest post for more detailed information.

pie_plot

The old Pizza Plot got renamed and revamped into the all new Pie Plot

pie_plot(name,
           data,
           width,
           height,
           background = None,
           gradient = False,
           shadows = False,
           colors = None)

gradient – Whether or not the slices are painted with gradient colors;
shadows – Now, it’s possible to draw a shadow behind the pie;
colors – And the user can pass a pre-selected list of colors for the slices;
Note: As this function’s been present since the last version, please refer to the latest post for more detailed information.

gantt_chart

No cosmetic changes on this one, but as the rest of the api, it got refactored on OO and the overall changes also apply.

gantt_chart(name,
            pieces,
            width,
            height,
            h_labels,
            v_labels,
            colors)

h_legend and v_legend – got renamed to h_labels and v_labels;
Note: As this function’s been present since the last version, please refer to the latest post for more detailed information.

donut_plot

Used to plot donut graphics.

donu_plot(name,
                data,
                width,
                height,
                background = None,
                gradient = False,
                shadows = False,
                colors = None,
                inner_radius = -1)

name – Name of the desired output file;
data – The list, list of lists or dictionary holding the data to be plotted;
width, height – Dimensions of the output image;
background – A 3 element tuple representing the rgb color expected for the background or a new cairo linear gradient. If left None, a gray to white gradient will be generated;
gradient – Whether or not the slices are painted with gradient colors;
shadows – It’s possible to draw a shadow behind the donut;
colors – Pre-selected list of colors for the slices;
inner_radius – The radius of the donut’s inner circle;

Example of use:

teste_data = {"carl" : 123, "fawn" : 489, "susan" : 890 , "lavon" : 235}
CairoPlot.donut_plot("donut_teste.png", teste_data, 500, 500)

Result:

function_plot

Used to plot function graphics.

function_plot (name,
                    data,
                    width,
                    height,
                    background = None,
                    border = 0,
                    axis = False,
                    grid = False,
                    dots = False,
                    h_labels = None,
                    v_labels = None,
                    h_bounds = None,
                    v_bounds = None,
                    step = 1,
                    discrete = False)

name – Name of the desired output file.;
data – The function to be plotted;
width, height – Dimensions of the output image;
background – A 3 element tuple representing the rgb color expected for the background or a new cairo linear gradient. If left None, a gray to white gradient will be generated;
border – Distance in pixels of a square border into which the graphics will be drawn;
axis – Whether or not the axis are to be drawn;
grid – Whether or not the grids is to be drawn;
dots – new parameter added to determine whether or not the dots are needed;
h_labels, v_labels – lists of strings containing the horizontal and vertical labels for the axis;
h_bounds, v_bounds – tuples containing the lower and upper value bounds for the data to be plotted;
step – the horizontal distance from one point to the other. The smaller, the smoother the curve will be;
discrete – whether or not the function should be plotted in discrete format.

Example of use:

data = lambda x : x**2
CairoPlot.function_plot('function_teste.png', data, 400, 300, grid = True, h_bounds=(-10,10), step = 0.1)

Result:

bar_plot

Used to plot bar graphics.

bar_plot (name,
              data,
              width,
              height,
              background = None,
              border = 0,
              axis = False,
              grid = False,
              dots = False,
              h_labels = None,
              v_labels = None,
              h_bounds = None,
              v_bounds = None,
              step = 1,
              discrete = False)

name – Name of the desired output file.;
data – The function to be plotted;
width, height – Dimensions of the output image;
background – A 3 element tuple representing the rgb color expected for the background or a new cairo linear gradient. If left None, a gray to white gradient will be generated;
border – Distance in pixels of a square border into which the graphics will be drawn;
grid – Whether or not the grids is to be drawn;
rounded_corners – Whether or not the bars should have rounded corners;
three_dimension – Whether or not the bars should be drawn in pseudo 3D;
h_labels, v_labels – lists of strings containing the horizontal and vertical labels for the axis;
h_bounds, v_bounds – tuples containing the lower and upper value bounds for the data to be plotted;
colors – List containing the colors expected for each of the bars.

Examples of use:

data = [3,1,10,2]
CairoPlot.bar_plot ('bar_teste.png', data, 400, 300, border = 20, grid = True, rounded_corners = True)

Result:

REMEMBER!

CairoPlot is on GitHub!

So, I hope you liked it. It’s been a while I’ve been trying to finish this release and I’m very proud of what it has become. Don’t forget to download and test it. In case any bugs surface or if you have any questions or suggestion, don’t be afraid to use the bug tracker or the answers options on the site CairoPlot Launchpad.

Thanks for the interest.

Today, Apple unveiled its new iPods (shuffle, nano, classic, touch) and, as expected, a brand new itunes with some new shiny functions.

The list of new functions is promising and features:

  • grid view: a whole new way of interacting and seeing your albums, providing easy access to all of them through thumbnails of their album covers;
  • new visualizer: great aesthetic change;
  • genius playlist and sidebar: after creating a new itunes account, itunes should get the ability to analyze your tunes and group them together, providing playlists of musics that “go great together”;

So, what’s the catch?
First of all, it is the SLOWEST itunes ever.

By the time I installed it, I jumped to see the grid view. It sure is awesome as it is pretty great to browse through your albums seeing all of its covers in a way that is much more practical than coverflow. The problem is that it takes time to load. My library only has one album and it is taking like 1 sec to open it…

I plugged my iPod and accessed the summary page (by clicking on the iPod name on the left side bar). It took an astounding 5 seconds to load. Not satisfied, I started clicking on the tabs (music, movies, tv shows, etc) and each one of them took 1 second to load.
I found out that, as always, coverflow was not available for inside iPod music browsing, as the new grid view isn’t too.

The genius options requires an itunes account, which I don’t have and didn’t create. What’s the point of needing an itunes account to search your own library for music “related” to the one you are listening? I get that the itunes account shouldn’t even be needed for the cases in which the software searches for related songs on the itunes store. The account should ONLY be needed when you try to buy something.

I have noticed in previous versions that itunes was a LOT slower in windows, but this time Apple did surprise me…

Last but not least, there have been a lot of users complaining about “blue screens of death” when they plug their iPods and iPhones (according to Gizmodo).

For all that reasons, I’ll be waiting for the 8.1 which I believe might be a little bit faster and a little less bugged.

Nota: Como o wordpress não permite adicionar vídeos do Vimeo, o link do vídeo é o seguinte: Sigg Jones

Passeando pelo Abduzeedo encontrei o vídeo do Sigg Jones:

Quando o campeão peso pesado Sigg Jones bebe um estranho energético, ele perde controle de si mesmo e de toda a sua parte boa. Seu agente terá que corrigi-lo…

Sigg Jones é o nome de um curta feito em 3D Studio Max por três estudantes da Escola Supinfocom na França.

O clímax do filme se dá numa seqüência de luta sensacional. O estilo e a modelagem são extraordinários.

Extraído de Abduzeedo

Eu achei que o estilo de modelagem parece muito com o do novo filme de Star Wars.

english version

As it seems, Brazillian Digital TV System is doing well.

This week, the SET (Television Engineering Brazilian Society) is hosting a meeting in São Paulo and many manufacturers and development groups are showing off their products.

As Cristina Diluca says, some of these groups (MOPA Embedded Systems and TQTVD) have already installed its system on Set-top boxes which rendered them able to decode and display applications downloaded over the air.

The guys at MOPA are also, the most advanced team on integrating cellphones with set-top boxes, using them as a return channel for it. Besides that, they are using Wiimotes! Two games have been developed and are installed on MOPA Set-top Boxes.

portuguese version

Ao que parece, o Sistema Brasileiro de TV Digital vai muito bem.

Essa semana, o SET (Sociedade Brasileira de Engenharia de Televisão) organizou uma conferência em São Paulo e muitos fabricantes estão presentes e mostrando seus produtos.

Como dito por Cristina Diluca, alguns fabricantes (MOPA Embedded Systems e TQTVD), já tem Set-top Boxes com seu sistema capazes de decodificar e apresentar aplicações interativas que são baixadas juntamente com o fluxo de vídeo.

A MOPA são também os mais avançados em integrar os celulares com os STBs, usando-os como canal de retorno. Além disso, eles estão usando os controles do Wii em aplicações! Como Cristina Diluca cita, dois jogos foram desenvolvidos e estão instalados nos STBs MOPA.